
EarthDefine Building Footprints 3D
202M+ buildings mapped, with heights and elevations. Available off-the-shelf.
EarthDefine Building Footprints 3D gives you GIS-ready building polygons for the entire United States: 202+ million buildings mapped from high-resolution imagery and LiDAR, with detailed and accurate rooftop outlines. Every building is tied to a street address, and 184 million carry LiDAR-measured heights, estimated stories, and volume. Available off-the-shelf and refreshed as new imagery and LiDAR become available.


Accurate, current, and ready to drop into your workflows.
Heights, estimated stories, and volume for RF simulation, line-of-sight analysis, and full 3D city models.
Building Footprints 3D provides GIS-ready building data to support a host of mapping and spatial-analysis functions.
To learn about the data shipped with each Building Footprints 3D license, download the product datasheet with the data dictionary. For complete picture of each deliverable, head over to the Samples page to download free samples for the full set of files and attributes.
Counts, coverage, sources, refresh cadence, schema, and licensing for Building Footprints 3D, in five pages. Data as of June 30, 2026.
The fields most people ask about, with a sample value for each. See the full data dictionary for all 43 point-schema fields and the polygon schema.
| Field | Description | Example |
|---|---|---|
str_UUID
|
Universal Unique ID of the entire structure associated with the Address | f985fa5b-9f2e-11eb-abd1-d89d67c66f28 |
bld_UUID
|
Universal Unique ID of the building from the parcel split associated with the Address | f9ea1bf5-9f2e-11eb-a32b-d89d67c66f28 |
Address
|
Full address of the building, including City, State, and ZIP Code | 8875 NW 26th St, Doral, FL 33172 |
Area_SqFt
|
Area of the building in square feet | 24,052 |
MaxHeight*
|
Maximum height of the structure based on latest LiDAR data calculated in feet, excluding potential clutter like an antenna, overhanging tree, etc. (NULL denotes no elevation data) | 14.48 |
Stories*
|
Model estimated number of stories based on building attributes if elevation information is available | 5 |
Volume*
|
Volume of the building based on the square footage and the mean height of the polygon in cubic feet | 1234.56 |
SourceDate
|
Source data date formatted as MM/DD/YYYY or YYYY when exact capture date is unavailable, will match the source as the most modern date the building was detected | 11/26/2019 |
* Available with a 3D license only.
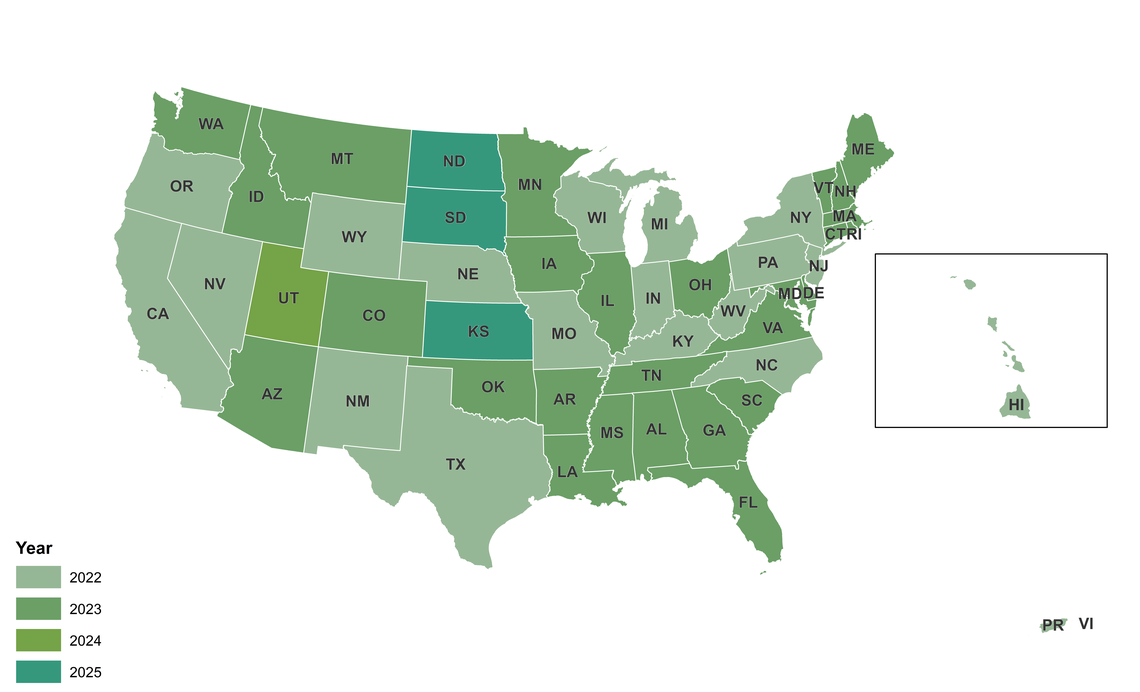
We release quarterly, refresh about half the states each year, and complete a full national refresh every two years. As our AI and post-processing advance, we make quarterly improvements. Every dataset reflects the latest publicly available imagery and LiDAR.
In the most recent quarter alone we added 688,295 structures and extended measured heights to a further 8.66 million.
Explore Dallas, TX in 3D: building footprints with heights, estimated stories, and volume.
Download the datasheet, or grab free samples for any of 49 US cities.
The majority of buildings are classified from USDA NAIP (National Agriculture Imagery Program) imagery, supplemented by publicly available LiDAR data where available.
The NAIP imagery is a mix of 30-60cm spatial resolution.
Buildings are classified from imagery using state-of-the-art deep-learning algorithms. Once classified, they are converted to vector format, regularized (squared up), split by parcel boundaries, addressed, and merged statewide.
Buildings get incredibly accurate and detailed outlines on a pixel-by-pixel basis, validated against dozens of urban areas across the country. By Intersection over Union (IoU), the accuracy is over 94%.
Because NAIP imagery is flown state-by-state, buildings are updated whenever new imagery becomes available. Most states fund NAIP every other year, so a nationwide refresh occurs roughly every two years. We also update buildings when we significantly improve our AI or post-classification processing; updates ship quarterly, with the most significant changes arriving alongside new imagery or LiDAR.
Beyond lags in available NAIP imagery, some areas retain older data where NAIP is not available or has not been updated. Military bases and other sensitive areas are examples where recent NAIP is not authorized for public use. Occasionally NAIP imagery does not meet EarthDefine's quality standards, in which case older imagery may be used to derive higher-quality footprints.
Not per building; the date on a building is the year of its source imagery. But each quarterly release is a complete national snapshot, so comparing releases reveals additions, removals and reshaped footprints across any area of interest.
Talk to our team about a nationwide or regional Building Footprints 3D license, or download a free sample to evaluate the data yourself.

