GIS for Positive Change
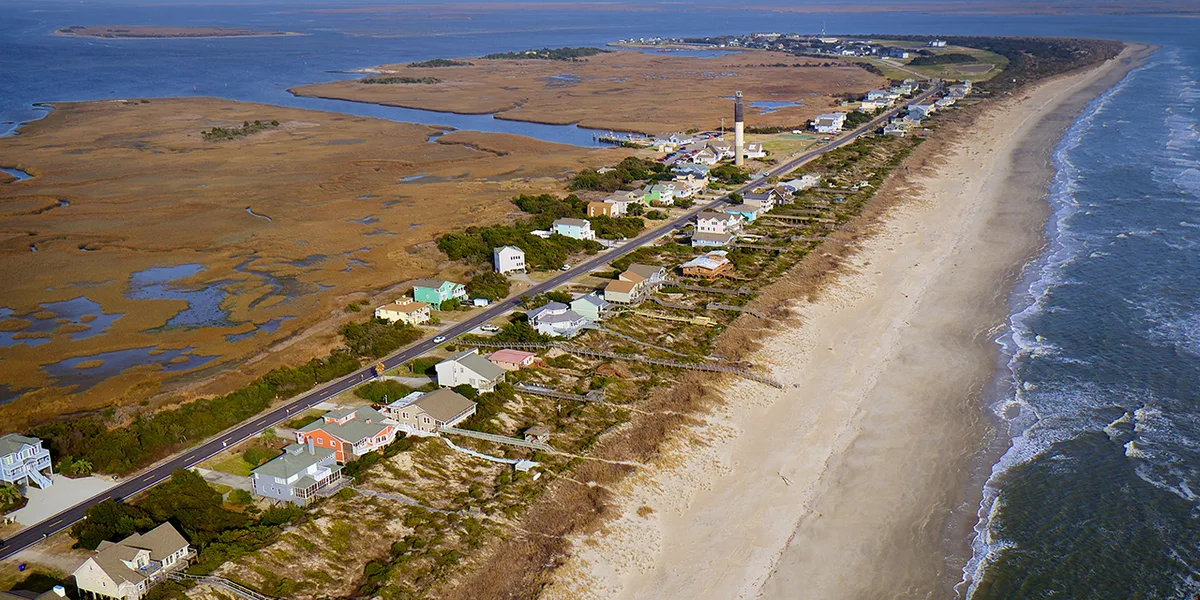
Two restoration stories, Oak Island's tree canopy and Washington's Dam removal, share one lesson: map what's actually there before you act. You can't manage what you can't see. Image: Eric Patterson
A town council rarely gets to see its future laid out on a map. In November 2023, GIS provided the Town of Oak Island, North Carolina, with the perfect opportunity.
A Town that Wanted to Know what it was Standing to Loose
Oak Island sits on the southeastern coast of North Carolina, a 12,700-acre barrier island known for its beaches, lighthouse, and as a nesting site for loggerhead sea turtles. For years, longtime residents felt that the tree cover they grew up with had been thinning. Feelings don't get funding, though, and they don't tell the town council where to focus a planting budget. What the town needed was quantitative (numbers, measurements, and counts) and qualitative (words, images, and descriptions) values represented through a map.
In 2022, the town commissioned a tree canopy assessment, with part of the funding coming from an Urban and Community Forestry Grant through the North Carolina Forest Service. The approach was straightforward: fly high-resolution aerial imagery over the island, then run it through AI-based land cover classification to understand canopies and their complexities across individual parcels and zoning districts within the town's boundaries.
What the Map Uncovered and Represented
The results presented to the Town Council in November 2023 gave Oak Island something it had never had before: a precise picture of its own tree cover.
- 59% had tree canopy across the town's 12,001 land acres, roughly 7,093 acres
- 23% were classified as PPA (possible planting area)
- 18% considered unsuitable for planting without significant land modification
The map didn't stop at what tree canopy was there. It also showed what could be. If the town used all of its available planting space, the assessment found it could theoretically reach 82% tree canopy cover. Additionally, it also showed where canopy was already being lost: two residential zoning districts had each shed roughly 11% of their tree cover over the prior 8 years, concentrated along specific stretches of road where development had moved in.
Those 7,093 acres of canopy do more than look good. The assessment put a number on the work they're doing:
- Over $2.5 million a year in air quality improvement, stormwater runoff prevention, and carbon sequestration (the process by which trees and soil absorb and store carbon from the atmosphere)
- More than $39 million in carbon has already been stored in the trees themselves
What this Could Mean for You
Oak Island's real lesson has less to do with trees and more to do with what happens when an organization can finally see the thing it's trying to manage.
- A council that used to work from impressions now works from a map.
- A planting program that used to guess now knows exactly where to plant, how much room is left to grow into, and which neighborhoods are losing ground the fastest.
Whatever resource you're managing- a tree canopy, a stormwater system, a road network- the same principle holds. You can't manage what you can't see.
These systems typically take years, considering the time it takes to wait for the next manual survey. That's exactly the gap that EarthDefine's Tree Map and Canopy Height data are built to close: a current, parcel-level picture of tree cover and planting capacity, anywhere in the country, instantaneously.
Curious what this looks like for your community? Request a free sample

"GIS is now telling the story of the world's environmental decline."
— Jack Dangermond, Mongabay interview, October 2024

Bringing the Salmon Home: Washington
For nearly a hundred years, Condit Dam had been situated across the White Salmon River in Washington, cutting off salmon and steelhead from the ancestral waters they had returned to for generations.
A River that Had Been Closed for a Century
The Condit Dam sat 5.3 kilometers or 3.3 miles up the White Salmon River, a tributary that feeds into the Columbia River. It had blocked anadromous fish- the salmon and steelhead that hatch in freshwater, grow up in the ocean, and return upstream to spawn- since its construction in the early 1900s. By the time anyone seriously proposed taking it down, nobody working on the project had ever seen wild salmon reach the upper river. The question wasn't just whether the dam could be removed. The real question was whether the fish would actually come back once the dam was removed, and whether the habitat waiting for them was still capable of supporting good fish habitat.
Mapping the River Before Touching the Dam
Before a single piece of concrete was removed, the U.S. Geological Survey built a picture of what conditions looked like upstream. They compiled a LiDAR flight of the river corridor, added bathymetry data describing the streambed itself, and layered in existing salmon redd surveys- the nest sites where fish had been spawning downstream of the blockage. Put together in a GIS, that data identified which stretches of river had the depth, gravel, and structure salmon needed, and which ones would need restoration work before they were ready.
That's the same core method behind EarthDefine's DEM/DSM and Land Cover data: LiDAR-derived elevation and surface detail, built to answer exactly this kind of "where is the habitat actually good" question before anyone commits to a restoration plan.
That mapping mattered because dam removal alone doesn't guarantee increased fish presence. Since increasing fish population is the goal, a river reintroduced to fish that swim into degraded habitat is still a dead end for population rehabilitation. Knowing exactly where good habitat is or isn't present is precisely what the state needed for hard records: to perform budgeting, planning, and reasoning about removing the dam.
What Happened Once the River Opened
Condit Dam was breached in 2011 and fully removed in 2012, opening up habitat that had been cut off for a century:
- Up to 33 miles of newly accessible steelhead habitat
- Up to 14 miles of newly accessible salmon habitat
Thankfully, the fish found it and put the region to good use. USGS began monitoring juvenile salmonids in 2016, five years after the breach, and the numbers told a clear story:
- Roughly 3,851 out-migrating steelhead smolts and 1,093 Coho smolts moving through the newly reopened watershed in 2016.
- Juvenile Chinook salmon counted at the monitoring trap jumped from just 4 present to 222 juveniles the following year.
Steelhead and Coho tagged upstream were later detected far downstream at Bonneville Dam on the Columbia, confirming they'd made the full run out to the ocean and could, in time, come back to spawn again.
What this Could Mean for You
The dam removal drew the headlines. The mapping that preceded it did not, yet it was the reason restoration crews knew where to direct their effort rather than distributing it evenly across a river system they did not yet fully understand. The pattern is worth recognizing: the visible, dramatic action, breaching a dam, succeeded only because of the less visible work that came first, establishing precisely what the land and water looked like before either was touched.
Whatever the natural resource is- a river, a forest, a coastline, the same order tends to hold. Know it well before you try to fix it.
EarthDefine's DEM/DSM and Land Cover data exists for exactly that first step: a current, high-resolution picture of what's actually there before a restoration or planning dollar gets spent.
Curious what this looks like for a river, forest, or coastline you manage? Request a free sample
Related products
Canopy Height Model
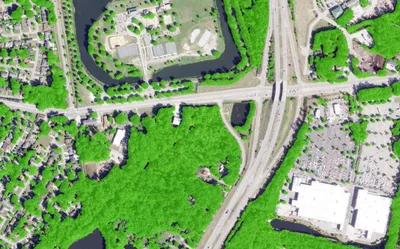
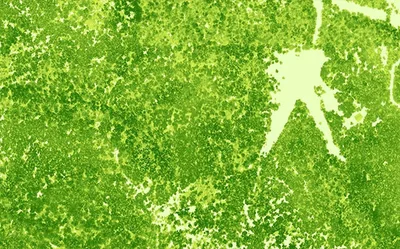
85%+ of the US at 50cm resolution. Tree heights in feet. Produced to order using the latest available LiDAR.
Learn more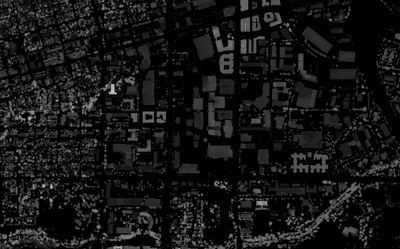

Land Cover
Seven ground-cover classes at 30cm or 60cm resolution, produced on demand for your area of interest across the United States.
Learn more