A Buyer's Guide: How to Choose a US Building Footprint Dataset
Sep 21, 2026
Compare EarthDefine Building Footprints 3D with Microsoft, Overture, and FEMA on parcel-level detail, measured heights, U.S. coverage, update frequency, and licensing. This guide draws on our experience maintaining more than 202 million parcel-split building footprints across the United States.
Generated from this page, last revised 30 September 2026. The link always serves the current version.
On this page
- The dataset in numbers
- What does "building" mean in this dataset?
- How the options compare at a glance
- Why precise building shapes matter
- Coverage: every county, and a measured gap in every state compared
- What's in a record
- Accuracy: what we publish, and what we don't
- Who buys it, and for what
- What you can do with each license
- The value of a finished building dataset
- How to buy
- How can our data help your project?
Overview
A dataset’s value goes beyond its footprint count: what can you reliably do with each building, parcel, and address?
This guide compares public US datasets with EarthDefine across five practical questions:
- How are buildings split?
- Are heights measured or estimated?
- What attributes come with each polygon?
- How current is the data?
- What does the license allow you to build?
It highlights where EarthDefine’s parcel-level approach and 3D attributes add value, where public datasets may be sufficient, and the cost and engineering effort of combining separate public sources into a building-footprint layer.
For details on how EarthDefine’s data is built, verified, and delivered, see the Building Footprints 3D technical specification.
The dataset in numbers
Data as of June 30, 2026, refreshed quarterly.
- Buildings, split at parcel boundaries
- 202,285,763
- Structures (contiguous building masses)
- 193,362,521
- Coverage
- All 3,227 US county equivalents, with partial coverage in remote areas of Alaska.
- Buildings with LiDAR-measured heights
- 184,527,713, 91.2% of all buildings
- Address points delivered
- 277,544,281
- Attributes per building
- 3 polygon fields plus 43 point fields, 12 of them 3D metrics
- Added last quarter
- 688,295 structures; measured heights extended to 9,264,800 more, a 5.6% jump in one quarter
- Sources
- USGS LiDAR plus 30cm to 60cm aerial imagery
- Release cadence
- Quarterly. Each release has improvements from updated AI and newer LiDAR and state/local imagery. Source imagery is refreshed annually for half the states each year.
- Coordinate system
- WGS84 (EPSG:4326), vertical datum NAVD88
- License
- Annual or permanent commercial licenses, national, state, county, or custom geography. No share-alike obligation.
- Access
- Bulk files in standard GIS formats, or the Buildings API. First 50 tokens free to evaluate. Pricing starts at $750 for 5000 calls.
EarthDefine Building Footprints is the largest US dataset we have identified, public or private, with a published count. Against the largest public alternative, Overture Maps, the margin is over 35 million structures on the same counting basis.
What does "building" mean in this dataset?
EarthDefine’s footprints exist at two levels: a structure [one contiguous physical building mass], and a building [that same structure split by parcel boundary]. Microsoft’s US Building Footprints, Overture Maps’ Buildings theme, and FEMA’s USA Structures generally provide structures/footprints rather than EarthDefine’s parcel-split building records. A connected townhome row or strip mall may therefore be represented as a single or fewer footprint records rather than one record per parcel. Overture also provides building-part features, but these represent building components rather than EarthDefine’s parcel-based subdivision. So a townhome row in their dataset will show up as one building spanning several parcels.
EarthDefine reports both structures and buildings because the latter are split at parcel boundaries.
- Use the structure count (193,362,521) when comparing against Microsoft, Overture, or FEMA.
- Use the building count (which are split by parcel boundaries; 202,285,763), when working with the delivered parcel-split records.
How the options compare at a glance
EarthDefine against three public US datasets: Microsoft US Building Footprints, Overture Maps Buildings, and FEMA USA Structures.
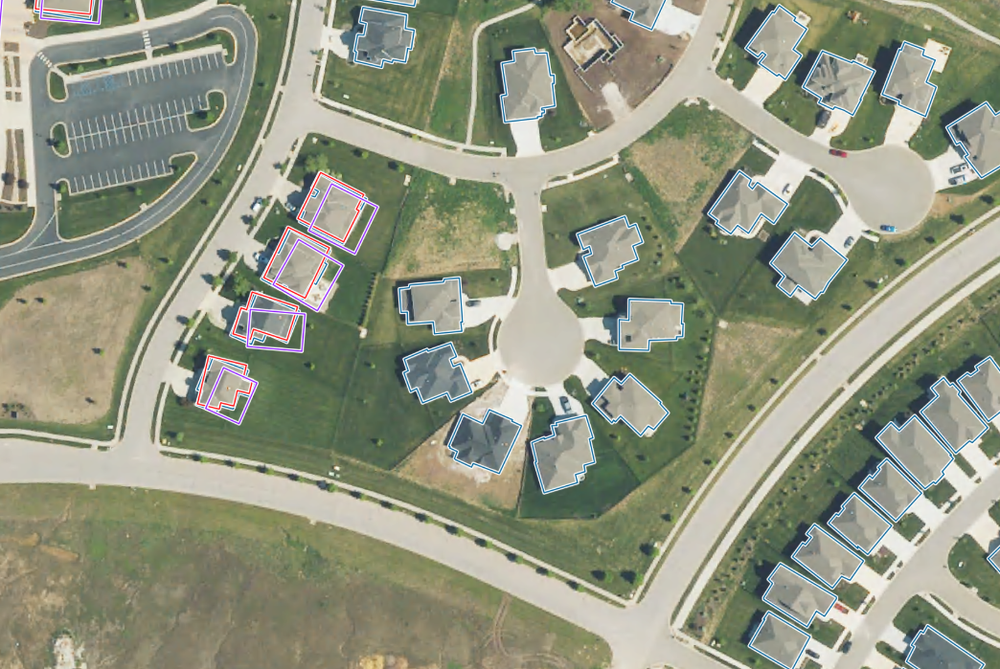
To assess the shape and fidelity of EarthDefine's data and to compare them with one of the alternatives, use the layer viewer below.
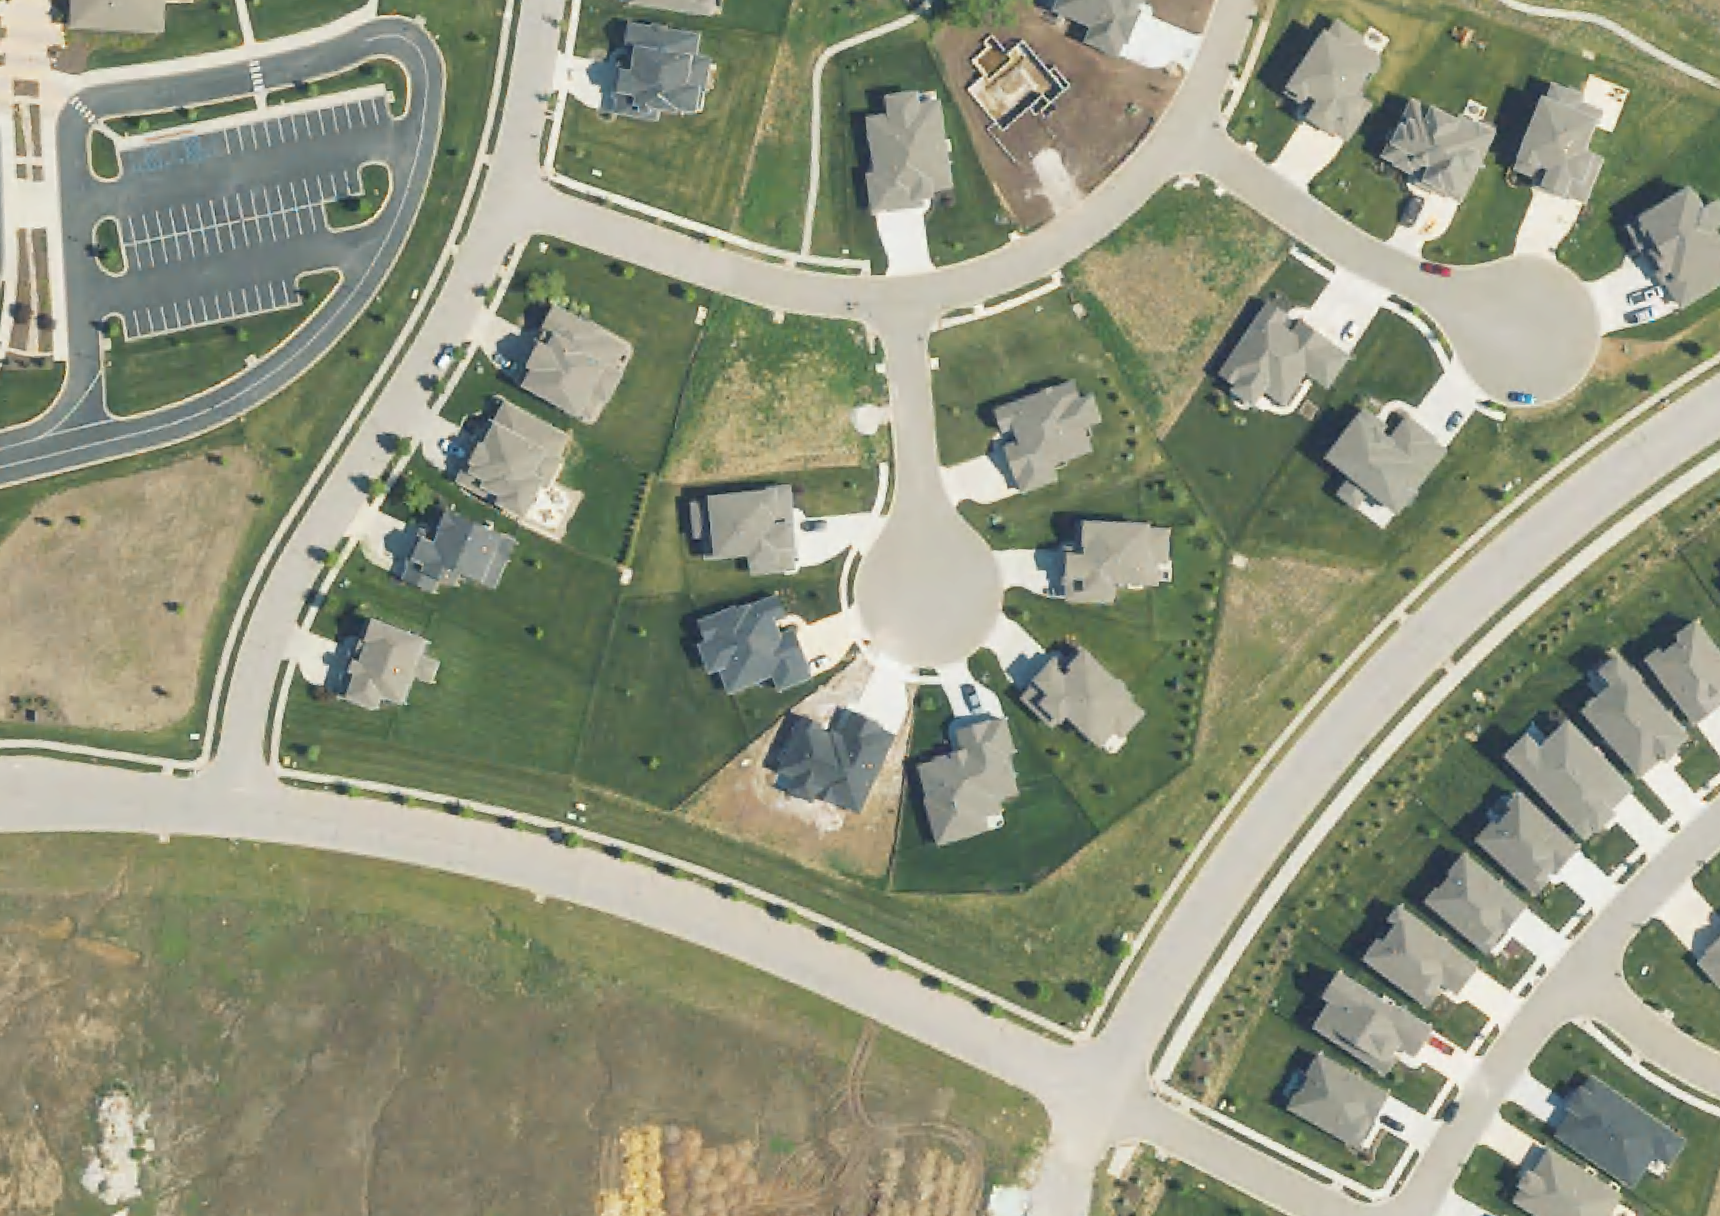


Figure 1a. Building footprints from EarthDefine, Microsoft US dataset, and FEMA as independent data layers over base imagery.
| What you get | EarthDefine Building Footprints 3D | Microsoft US Building Footprints | Overture Maps Buildings | FEMA USA Structures |
|---|---|---|---|---|
| Maximum coverage of structures* | ✓ 193,362,521 | ✗ 129,591,852 | ✗ 158,352,541 | ✗ 135,252,581 |
| Heights included | ✓ 166.8M structures | ✗ none | ✓ 115.7M structures | ✓ 31.9M structures |
| Heights measured from LiDAR, not estimated from imagery | ✓ | n/a | — | ✓ where present in 133 cities |
| Roof slope, ground elevation, stories, volume | ✓ | ✗ | partial: floors on 1.9% | — |
| Address attached to each building, with a confidence score | ✓ | ✗ | — | — |
| Buildings split at parcel boundaries | ✓ | ✗ | ✗ | ✗ |
| Source date on every building | ✓ | partial, where imagery vintage can be deduced | — | — |
| Data freshness | ✓ 2023-2025 | ✗ about half from 2019-2020, rest around 2012 | ✗ varies by source | ✗ most pre-2018, some 2016-2021 |
| Outline traced to the roof edge | ✓ | ✗ simplified polygons | ✗ simplified polygons | ✗ boxy outlines |
| Parcel ID and land-use codes | ✓ (from Regrid parcel data) | ✗ | — | — |
| Reviewed by human data analysts before release | ✓ | ✗ | — | — |
| Fixed, publicly stated update cadence | ✓ quarterly | ✗ none stated | ✓ monthly | — |
| Commercial license, no share-alike clause | ✓ | ✗ ODbL (Open Database License) | ✗ ODbL (Open Database License) | ✓ public domain |
| Publicly downloadable for independent verification | ✗ only samples; data available for purchase | ✓ | ✓ | ✓ |
| Every US county or equivalent covered | ✓ 3,227 | — | ✓ | ✓ |
✓ yes ✗ no — not stated in the sources we checked; ask the provider
* Comparing structure counts since Microsoft, Overture, and FEMA do not report building counts.
EarthDefine figures as of June 30, 2026. FEMA figures from our April 2026 comparison. Microsoft US Building Footprints figures are Microsoft’s own published values, repository checked Sep 21, 2026. Overture figures from their 2026-07-22 release, counted by us on Sep 21 2026; cadence and building model from docs.overturemaps.org, checked Sep 21, 2026.
Sources for the ODbL column: the LICENSE file and README in github.com/microsoft/USBuildingFootprints, checked Sep 21, 2026, both of which state that Microsoft licenses that dataset under the Open Data Commons Open Database License; and docs.overturemaps.org, checked September 21, 2026 (Overture’s buildings theme is ODbL because it incorporates OpenStreetMap data; other source datasets incorporated into the theme may carry different licenses, but Overture publishes the Buildings theme under ODbL).
(a) Merged polygon, public dataset
(b) EarthDefine, split at the parcel lines
Figure 1b. Parcel-split pair. Same townhome row or strip mall over imagery; left, the merged polygon from a public dataset; right, EarthDefine’s buildings split at the parcel lines, parcels drawn.
Why precise building shapes matter
For some projects, a simplified outline is enough. If you’re counting buildings, checking whether a parcel has a structure, or assigning a rooftop point, you may not need an outline that follows the roof. In some cases, a centroid will do.
Precise outlines matter when small differences in location or shape affect the result. A simplified polygon can misstate distances, overlaps, or usable area, changing downstream calculations. For example:
- Rooftop solar: Panel layout and energy estimates depend on usable roof area and shape. A rectangle drawn around a cross-gabled house may include space where panels cannot fit.
- Insurance assessments: Whether a building overlaps a mapped flood zone, or how close it is to trees, wildfire fuels, or neighboring buildings, can affect an assessment.
- Roof replacement and claims estimates: Material quantities depend on the roof’s area and shape.
- Municipal stormwater programs: Parcel-level estimates of building and other impervious area can change when building outlines are inaccurate.
For these applications, polygon accuracy is a data requirement. A missing building is often easy to spot; an inaccurate outline can be harder to catch because it may still produce a plausible measurement. In the accuracy section below, we explain how public datasets create their outlines and how EarthDefine produces and reviews its own.
Coverage: every county, and a measured gap in every state compared
EarthDefine covers 3,227 US counties, rural and urban, in every state and territory¹. We recommend that you test any coverage claims on every state, not just the national total. Nationally, the gaps run to tens of millions.
Below, we have provided a comprehensive comparison table (based on structures, since that is the unit available in these datasets).
| Microsoft US Building Footprints | Overture Maps Buildings | FEMA USA Structures | |
|---|---|---|---|
| US count | 129,591,852 | 158,352,541 (incl. territories) | 135,252,581 |
| Missing buildings compared to EarthDefine | 63,770,669 (33% missing) | 35,009,980 (18% missing) | 58,109,940 (30% missing) |
| Coverage gap, per-state method | Not yet measured against this release | 36,000,390 (19% missing) | 60,760,541 (31% missing) |
| Structures with heights | None; this release carries no height attribute | 115,676,811 (73% of their total); derivation not published | 31,926,232 (24% of their total), LiDAR-derived, limited to 133 cities |
| Source vintage | 73 million from 2019 to 2020 imagery, rest average around 2012 | varies by source | 2016 to 2021, most before 2018 |
| License | ODbL, share-alike | ODbL, share-alike | Public domain |
| Snapshot | Microsoft’s published figures, checked Sep 21, 2026 | Release 2026-07-22, counted September 2026 | April 2026 |
Microsoft also publishes a separate machine-learning footprint dataset covering geographies worldwide. This guide compares the dedicated US Building Footprints release, not Microsoft’s Global ML Building Footprints dataset, which has different licensing.
¹ Remote interior Alaska outside populated areas is partially covered, and sites where the federal government restricts aerial imagery may carry older or missing data.
Figure 2a. Structures and height coverage, three US datasets. EarthDefine 193,362,521 structures, 166,797,159 carrying LiDAR-measured heights. Microsoft US Building Footprints 129,591,852 structures, no height attribute. FEMA USA Structures 135,252,581 structures, 31,926,232 carrying heights. Counts here are structures rather than parcel-split buildings, which is why EarthDefine’s share reads 86.6% against the 91.2% of buildings quoted earlier in this guide.
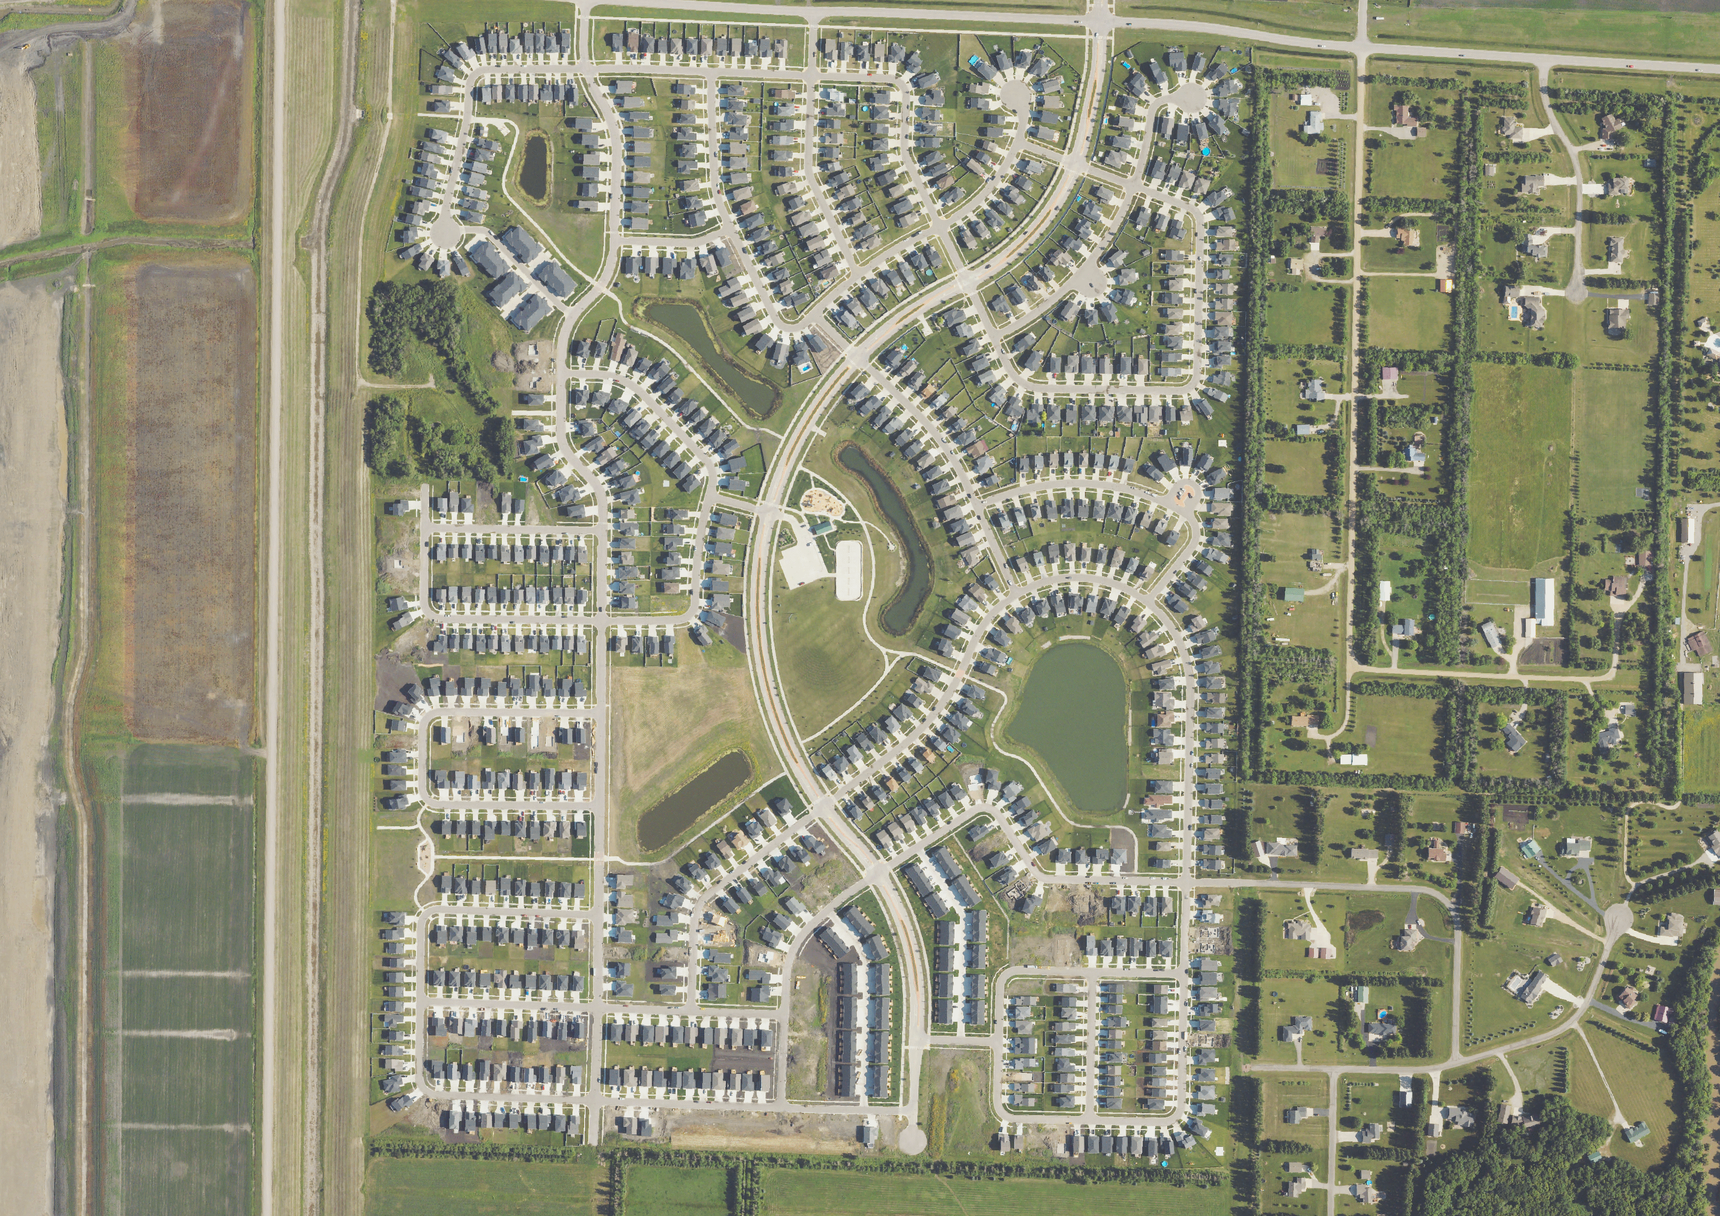
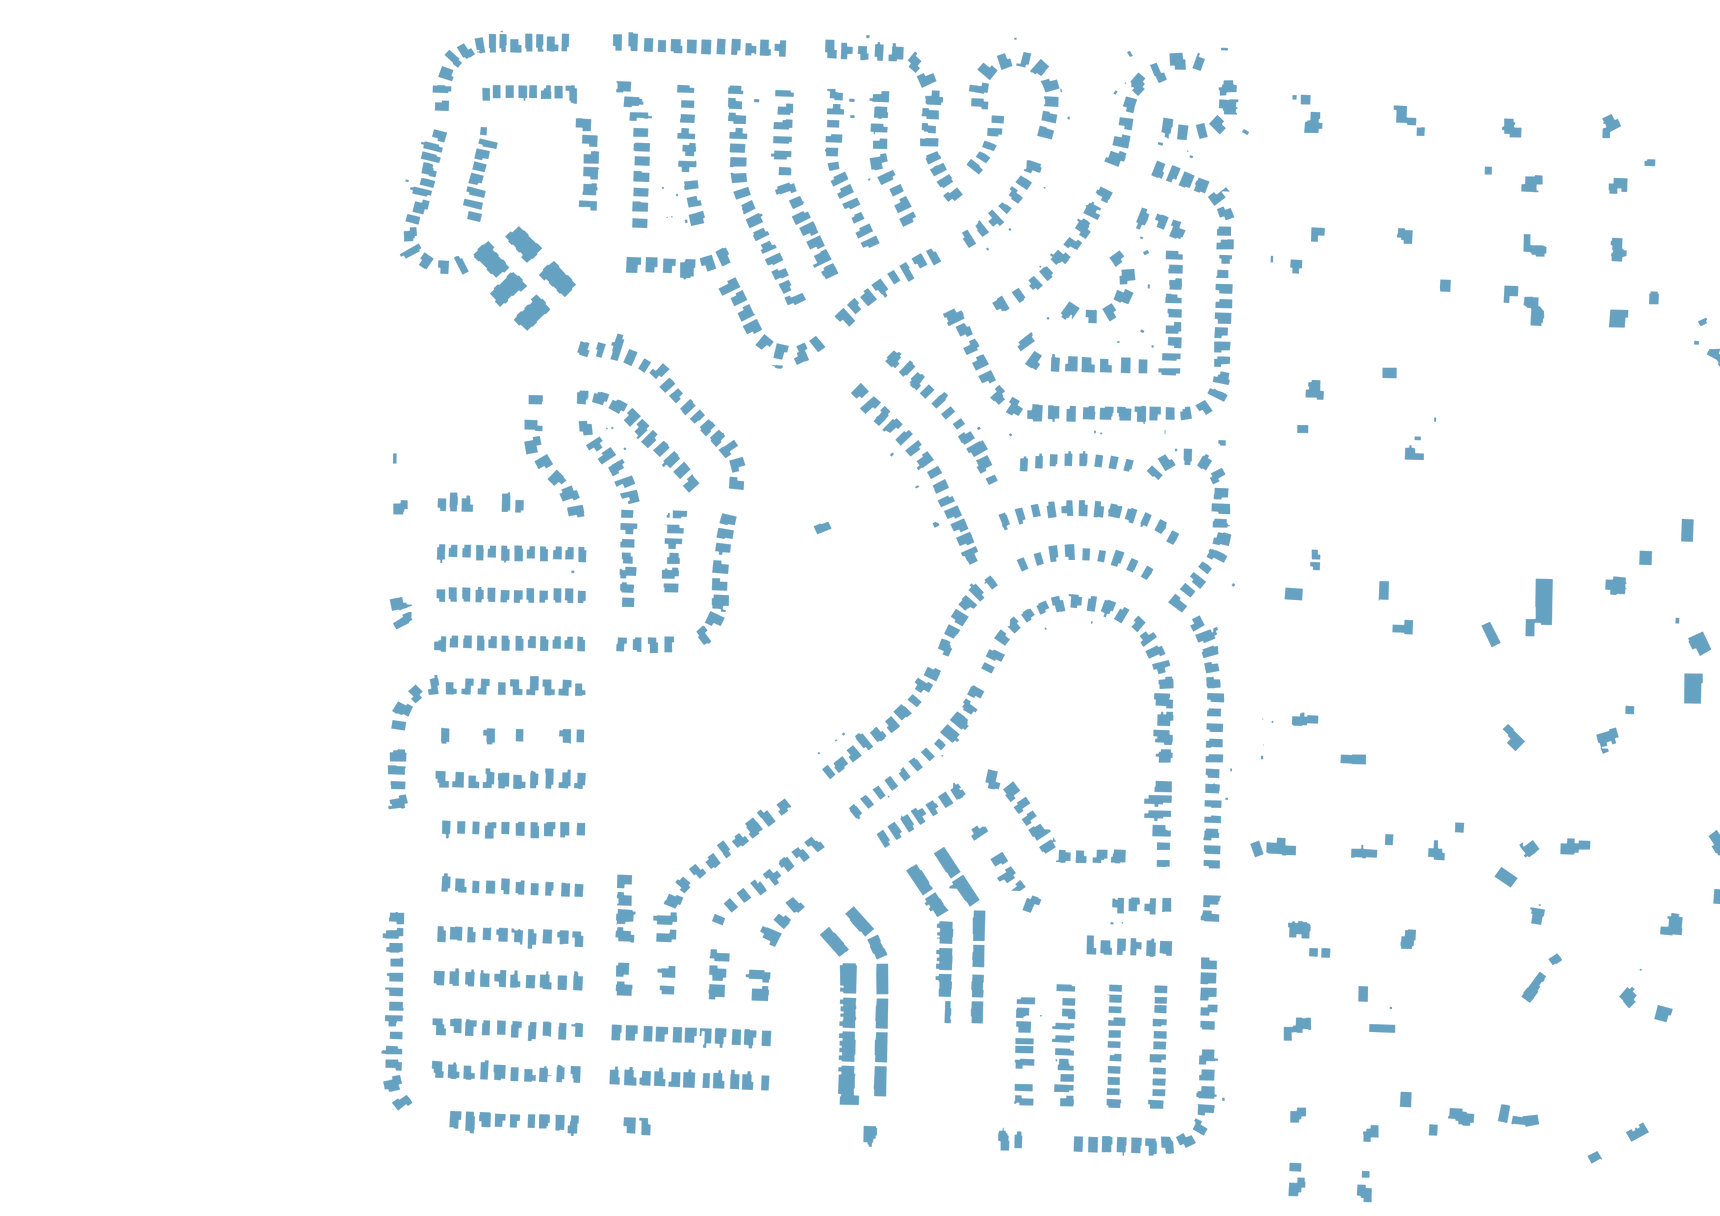
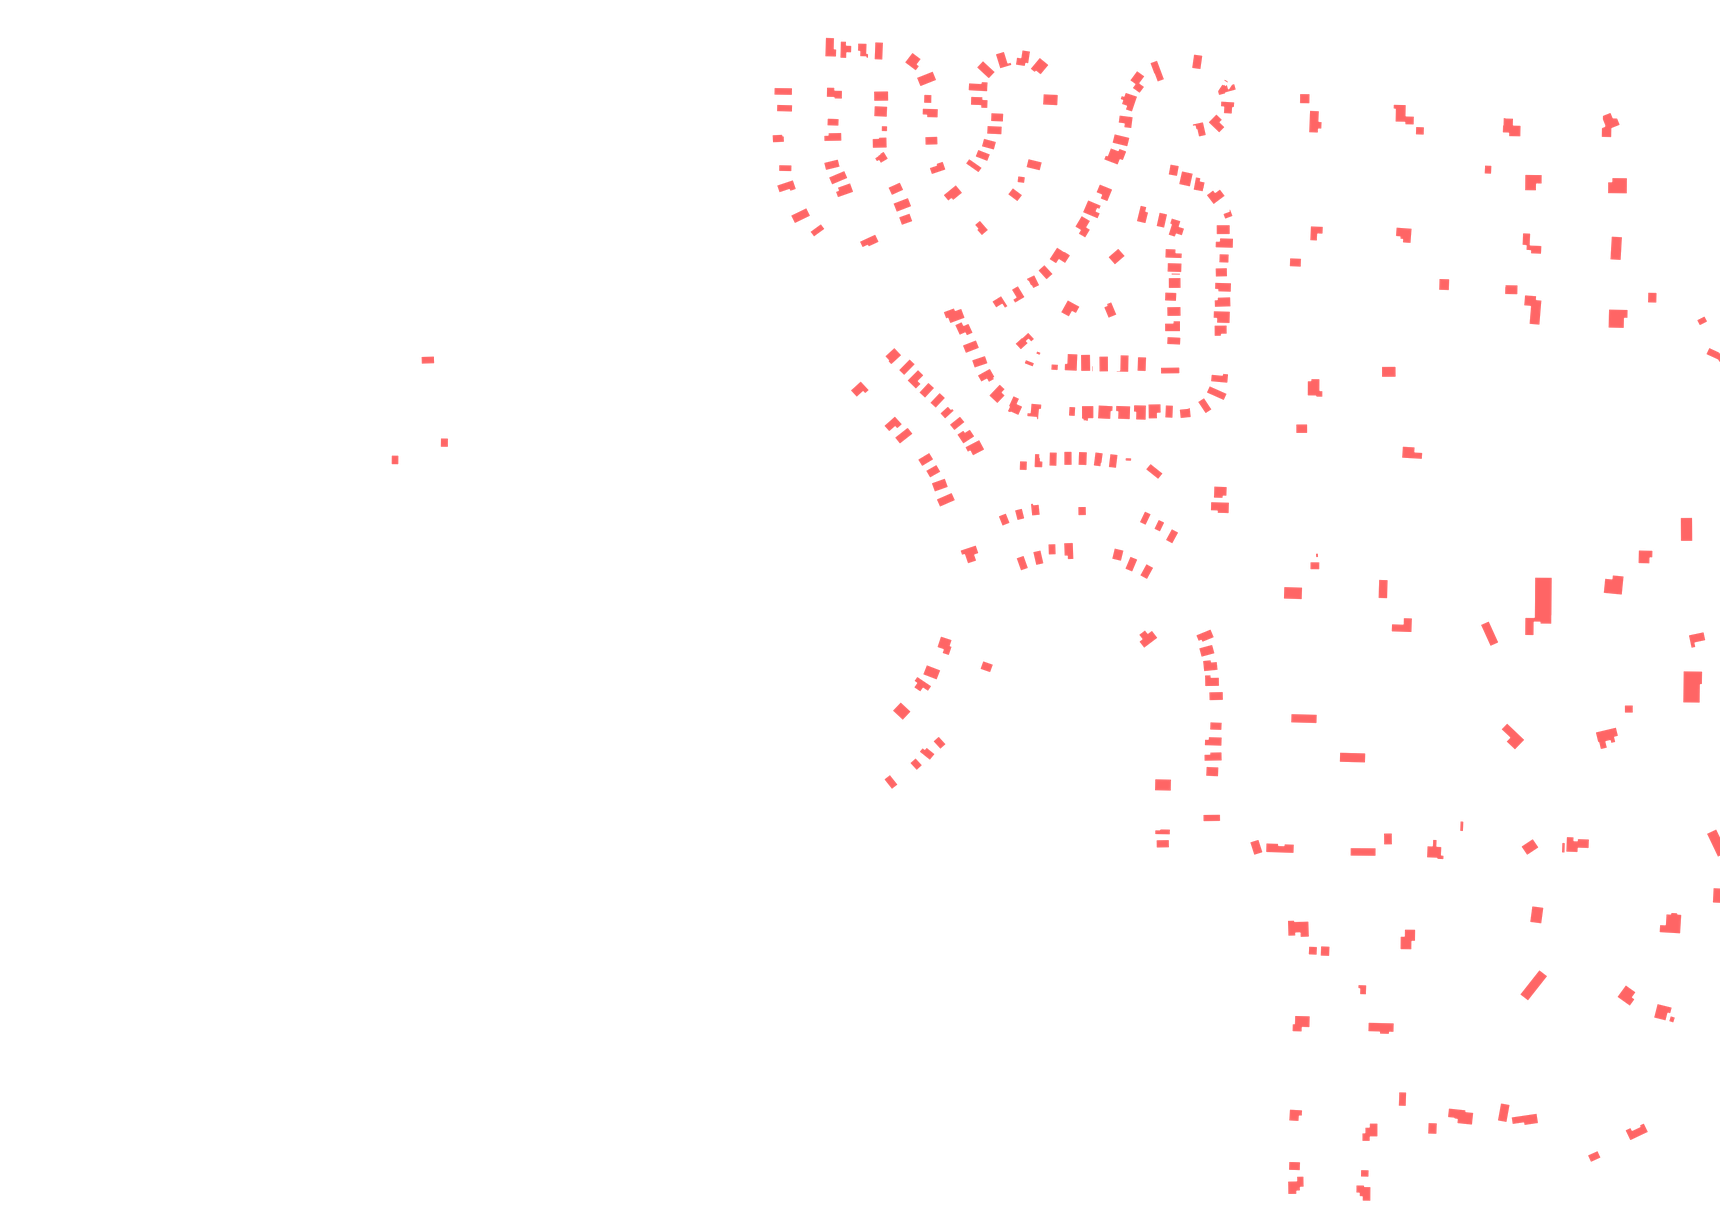
Figure 2b. The coverage gap on the ground: West Fargo, ND.
Location: 46.79913245, -96.91894258

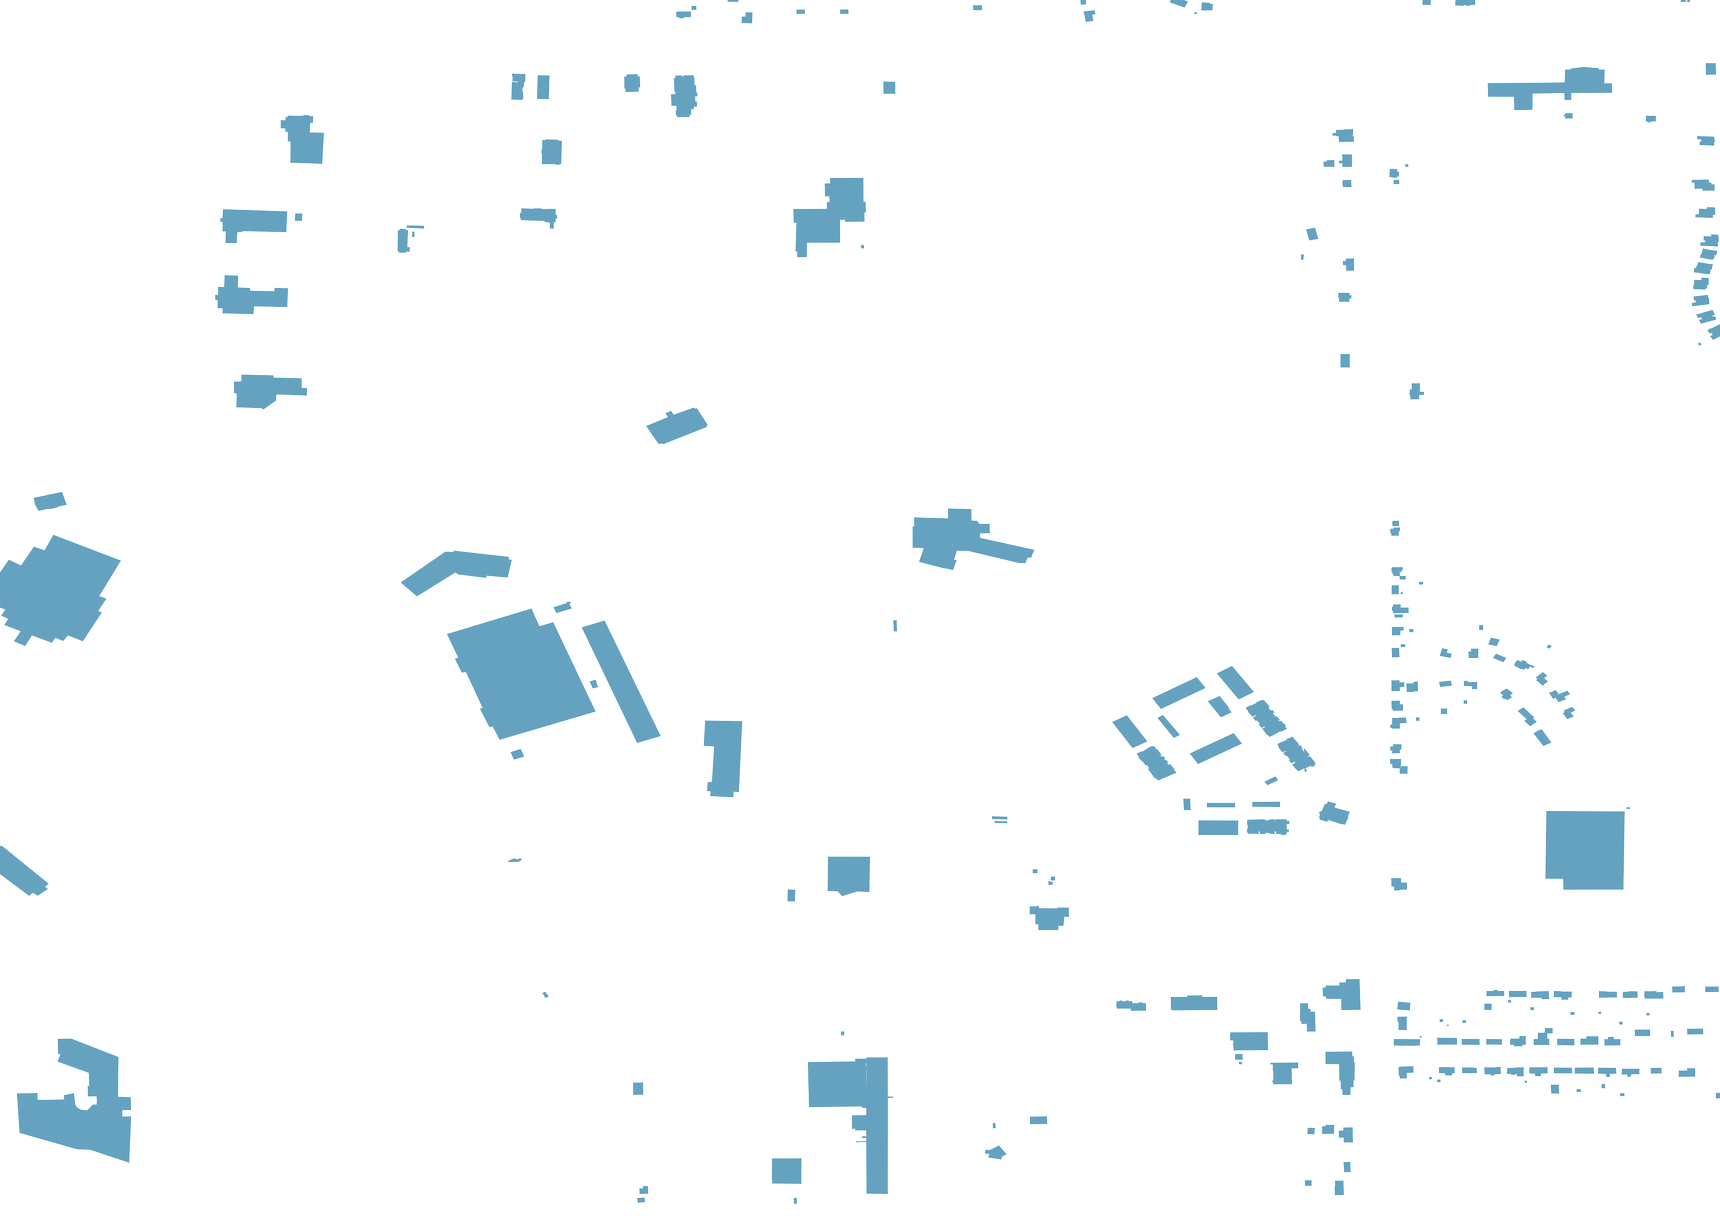
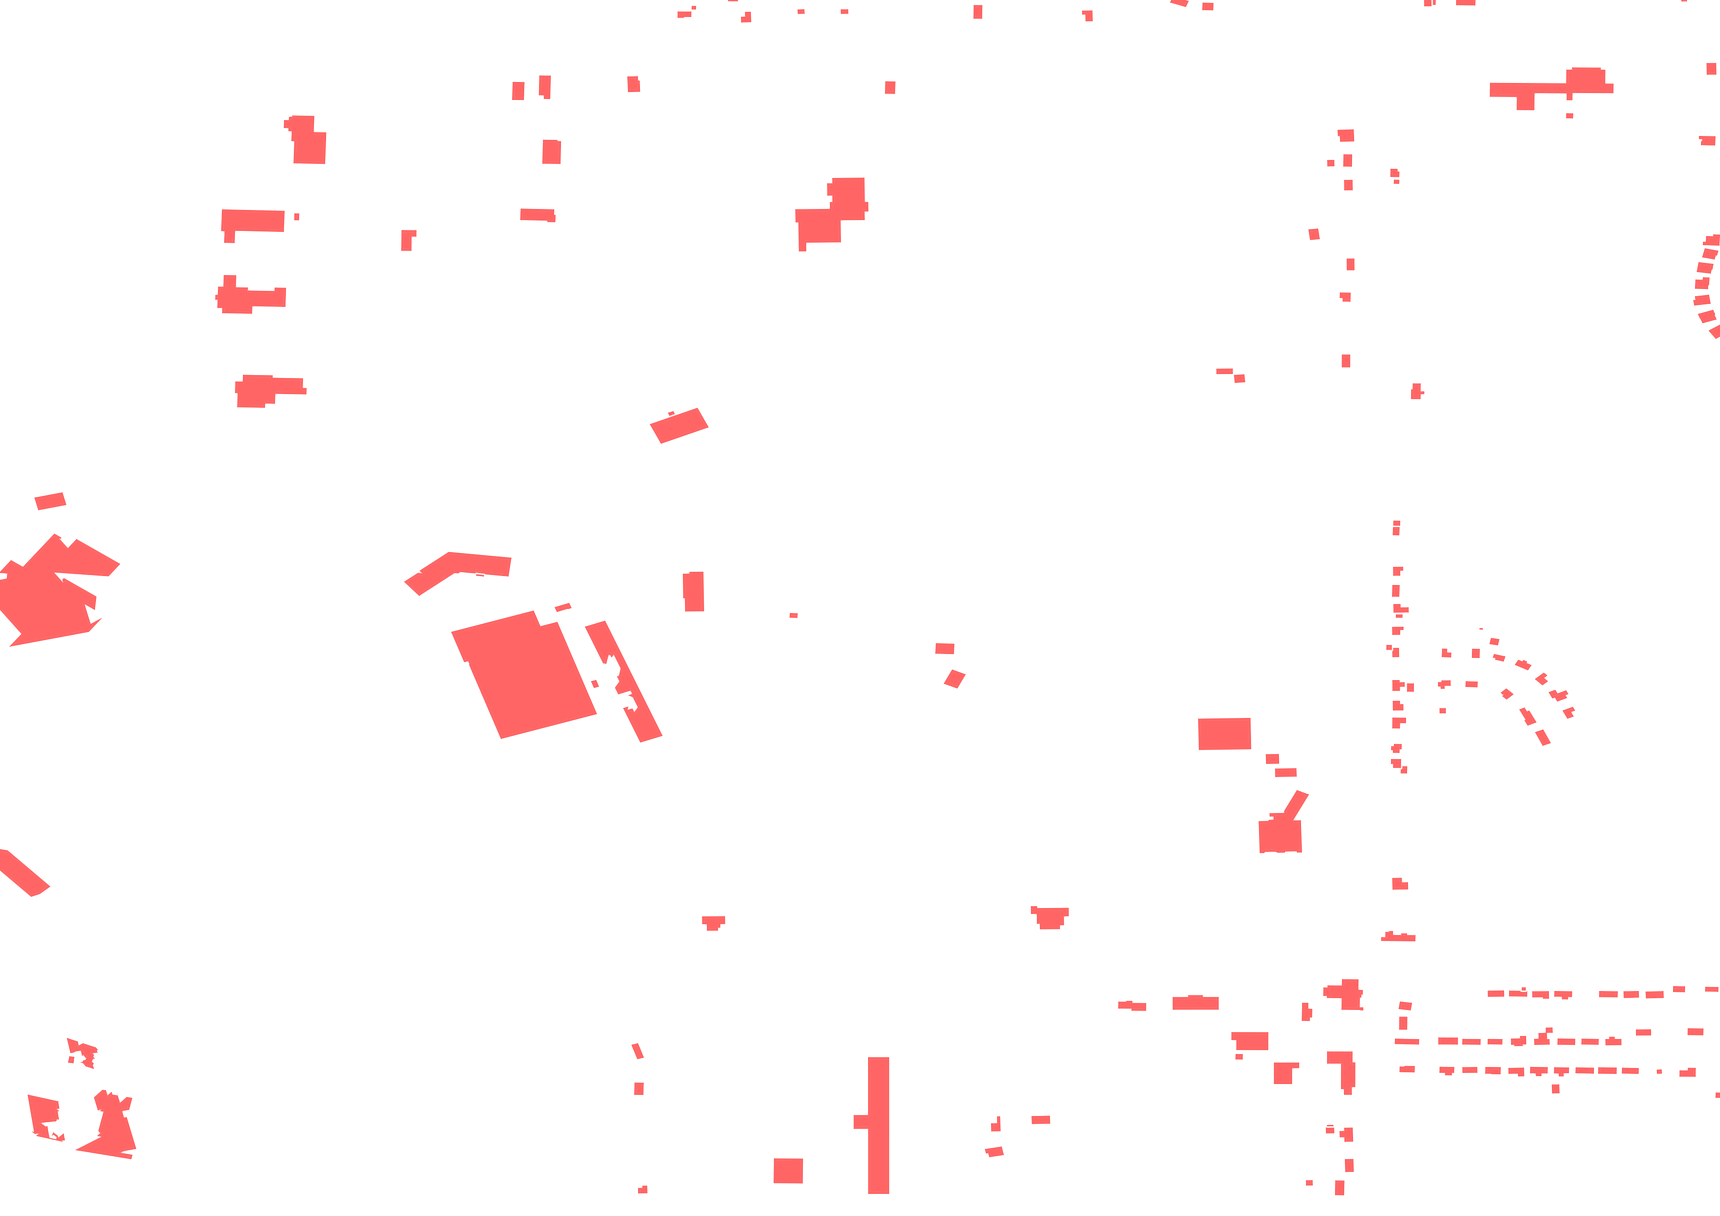
Figure 2c. Coverage difference in Kansas City, KS.
Location: 39.12096608202405, -94.80699702270923
What's in a record
Every EarthDefine building comes as a polygon plus one or more address points that join on the same identifiers. Below is the point schema from the current data dictionary, grouped by what it’s for. Note: (a) 3D fields are available with the 3D license tier; the 2D footprint license does not include these attributes, (b) the parcel and land-use fields derive from Regrid parcel data.
| Group | Fields | What it lets you do |
|---|---|---|
| Identity and geometry | str_UUID, bld_UUID, Area_SqFt, Latitude, Longitude, Largest | Join points to polygons, track a building across releases (identifiers are semi-stable), pick the primary structure at an address |
| Address | Address, Address_No, Street, SubAddress, City, STPostal, ZIP, State, County, CTFIPS, Add_Conf | Geocode, match to your own records, and weight each match by its low / medium / high confidence |
| 3D, LiDAR-measured | MaxHeight, MeanHeight, MaxObjectH, LAG, HAG, MeanElev, MeanSlope, MaxSlope, ModeSlope, Stories, GrossArea, Volume | Roof pitch and height for underwriting and solar, adjacent grade for flood and drainage, stories and gross area for valuation, volume for HVAC capacity and energy consumption in energy and RF models |
| Parcel and land use | ll_uuid, lbcs_activity, lbcs_function, lbcs_structure, lbcs_site, lbcs_ownership, each with a description field | Identify land use and the parcel it sits on |
| Provenance | Source, SourceDate | Know whether each footprint came from imagery or LiDAR, and when it was last seen |
Polygon schema: str_UUID, bld_UUID, Area_SqFt. A contiguous structure keeps one str_UUID; each parcel-split building under it gets its own bld_UUID. This allows you to work at either level without losing the link between them.
On a parcel with a single building, our addresses typically match what a good parcel dataset would already give you. A parcel-only approach can be insufficient when multiple structures occupy the same parcel because it assigns every structure the same address. EarthDefine addresses each building individually, so multiple buildings on one parcel can carry different addresses. We also provide addresses where no parcel exists at all.
Figure 3. Heights cross-section. Cross-section of one building showing MaxHeight, MeanHeight, MaxObjectH (antenna), Lowest and Highest Adjacent Grade (LAG, HAG), MeanElev, and roof slope.
A photograph of the Hildene House as viewed from outside the structure
EarthDefine Building Footprints and Address Points for the Hildene House and surrounding structures
Figure 4. Hildene House record card. All 3D buildings product information for the Hildene House in Manchester, VT
Accuracy: what we publish, and what we don't
The underlying sources have different specifications, so we do not combine them into a single product-wide accuracy number. Here is what we publish instead, and what you can get for any area of interest.
- Independent production and review. In many cities, EarthDefine starts from the municipality’s own planimetric building dataset, then reviews and edits it against newer aerial imagery, adding buildings the source missed and removing ones that no longer exist. Elsewhere, footprints come from EarthDefine’s own processing of public LiDAR and aerial imagery. EarthDefine does not use Microsoft, OpenStreetMap, Overture, or FEMA footprint geometry as an input to its own footprint layer. Overture’s Buildings theme, by contrast, incorporates multiple source datasets.
- Height accuracy. Heights are measured from LiDAR point clouds rather than estimated from imagery, and delivered as multiple values per building (maximum, mean, maximum-with-clutter) with ground elevations and roof slopes alongside. We do not publish a single product-wide height-accuracy figure; the published vertical specification of the underlying LiDAR collect is available for any area of interest.
- Positional accuracy. Footprints derive from three sources (NAIP imagery, state orthoimagery, LiDAR), each with its own published horizontal specification, so we do not quote a single blended figure. The source specification for any area of interest is available on request.
- Address confidence. Every address point carries
Add_Conf, a low, medium, or high confidence score based on the number of corroborating sources and the point’s positional relationship to the building. - Human review. Output is not shipped straight from the model. Record counts are reconciled at every production stage; each state passes a release checklist (id consistency, no null addresses, elevation sanity, source-date verification, tile-edge dissolve, spot checks against independent map services); counties are reviewed one by one with named-analyst sign-off; and the review work itself is audited, with errors classified as omissions, commissions, incomplete annotations, or mislabeling and worked examples issued back each round.
- Footprint accuracy. On our own evaluation set we measure a mean Intersection over Union (IoU) of 0.91 against manually digitized reference outlines. Microsoft publishes 0.86 for its US Building Footprints. The two figures come from different samples against different references, so read each as a provider’s account of its own data.
- Shape fidelity. Machine extraction from imagery often includes a regularization step that favors dominant orientations and right angles (Microsoft describes its polygonization as imposing “a priori building properties” and reports dominant-angle rotation error). Simplified building outlines can miss wings, bays, and inside corners. Our outlines follow the roof edges more closely, preserving these details for measurements and spatial analysis.
Who buys it, and for what
- Insurance and property risk teams need roof pitch, height, and footprint measurements for each insured parcel, along with nearby grade information for assessing flood exposure. Relevant fields include MeanSlope, MaxSlope, MaxHeight, LAG, HAG, and the parcel-level building splits identified by bld_UUID.
- Property intelligence and real estate teams need current building records that can be queried by address, with one building associated with each parcel. Relevant fields include bld_UUID, ll_uuid, Address, Add_Conf, and SourceDate.
- Telecom and RF planning teams need measured building heights and volumes to model signal propagation and line of sight. Relevant fields include MaxHeight, MeanHeight, Volume, and MeanElev.
- Municipal, stormwater, and planning teams need building area by parcel, land-use information, and complete coverage across the jurisdiction. Relevant data includes Area_SqFt, lbcs_* fields, and county-complete coverage.
- GIS and data teams need stable identifiers, standard file formats, and an API for looking up buildings. Relevant options include str_UUID, bld_UUID, WGS84 files, and the Buildings API.
What you can do with each license
| You can... | EarthDefine | Microsoft US Building Footprints / Overture Maps Buildings | FEMA USA Structures |
|---|---|---|---|
| Choose your license and coverage | ✓ Annual or permanent license; national, state, county, or custom geography | ✗ ODbL (Open Database License): dataset coverage is set by the provider | ✗ Public domain* : dataset coverage is set by the provider |
| Use the data without attribution | ✓ | ✗ Attribution and ODbL notice required for public use or distribution | ✓ |
| Modify, correct, or merge the data with your own | ✓ | ✓ but derivative database must be offered under ODbL | ✓ |
| Publish a map, PDF, or app layer based on the data | ✓ | ✓ Attribution and ODbL notice required. Produced Works are not subject to share-alike | ✓ |
| Keep your combined database proprietary | ✓ | ✓ Only if it is not a Derivative Database. Derivative Databases must be offered under ODbL | ✓ |
| Distribute under Digital Rights Management (DRM) or access controls | ✓ Subject to the license terms | ✓ but an unrestricted version must also be available without extra charge and with equivalent practical access | ✓ |
| Resell or embed in a product | ✓ Reseller and embedding terms available, ask us | ✓ commercially, but the database/derivative database remains subject to ODbL and its share-alike/access obligations. | ✓ |
* some data may be subject to copyright
This is a description of the license, not legal advice; the question of what a derivative database is in your specific architecture belongs with your counsel. What the table shows is that these public options are free to download and build on, but ODbL imposes ongoing attribution and share-alike obligations when the data is incorporated into a derivative database. Those obligations can affect how proprietary data is combined, distributed, and protected, potentially creating additional engineering and operational requirements for a commercial product.
The value of a finished building dataset
Free building footprints can be a good fit when their coverage, detail, and attributes meet your needs. When they fall short, the work shifts to your team: finding missing structures, correcting outlines, splitting buildings at parcel boundaries, matching addresses, and processing LiDAR for heights and roof slopes. Those tasks require time and expertise, and they must be repeated as source data changes.
EarthDefine does that work as part of producing and maintaining the dataset. Detailed outlines, parcel-split records, addresses, and source dates come together in a consistent schema, with LiDAR-derived attributes available through the 3D product. Analyst review and quarterly releases support ongoing use, while commercial licensing provides a path for proprietary applications without share-alike obligations.
The purchasing decision is therefore about the total cost of getting the building information your application requires and keeping it useful over time. Compare the license price with the engineering, review, and maintenance work you would otherwise take on, then test the data in an area you know. The strongest case for EarthDefine is the work it saves and the analysis it enables.
How to buy
| Buildings API | Bulk license | |
|---|---|---|
| Best for | Lookups, enrichment, pilots, evaluation, starting today | Portfolio-scale analysis, models, products |
| Query by | Address, coordinate, or region of interest | Delivered as files: national, state, county, or custom geography |
| Format | JSON | Standard GIS formats |
| Term | One year or until calls are used | Annual or permanent |
| Price | First 50 tokens free. Pricing starts at $750 for 5,000 calls. | Quoted for your area of interest; contact us |
| 3D attributes | Included | With a 3D license |
| Resellers | Reseller terms available, get in touch |
How can our data help your project?
See the difference on your own ground. Ask for a sample over a market you know, or request a quote for your area of interest. If you’d rather start now, you get 50 free tokens to evaluate our Building Footprints API that returns any address, coordinate, or region as JSON.
Learn more
A couple of ways you can dive deeper
Generated from this page, last revised 30 September 2026. The link always serves the current version.