Measuring shade where children actually are
Oct 20, 2026
In November 2021, Sharon Gamson Danks sent us an inquiry through our website. Sharon is the founder and CEO of Green Schoolyards America, a nonprofit that helps school districts turn paved grounds into greener places for children. She was looking for tree canopy data for California’s schools and wanted to know what statewide coverage would cost. She didn’t yet have a map of the school boundaries.
Our data is priced by area, so the statewide quote was more than the project could afford. Much of California was outside the area they needed. Green Schoolyards America worked with its GIS partner, GreenInfo Network, to send us boundaries for around 8,400 school campuses. We could then price the data for those campuses alone. Together with our 50% nonprofit discount, the smaller area brought the cost down to about one-twentieth of the statewide quote.
After the holidays, we delivered tree canopy data derived from 2020 aerial imagery at 60cm resolution. We clipped the data to the school boundaries and confirmed that they could publish maps using it. Our part of the delivery was complete.
Banner image © Green Schoolyards America. California Schoolyard Tree Canopy Equity Study, 2024.
What they did with it
The research team wanted to know how much tree cover there was in the parts of a campus children could actually use.
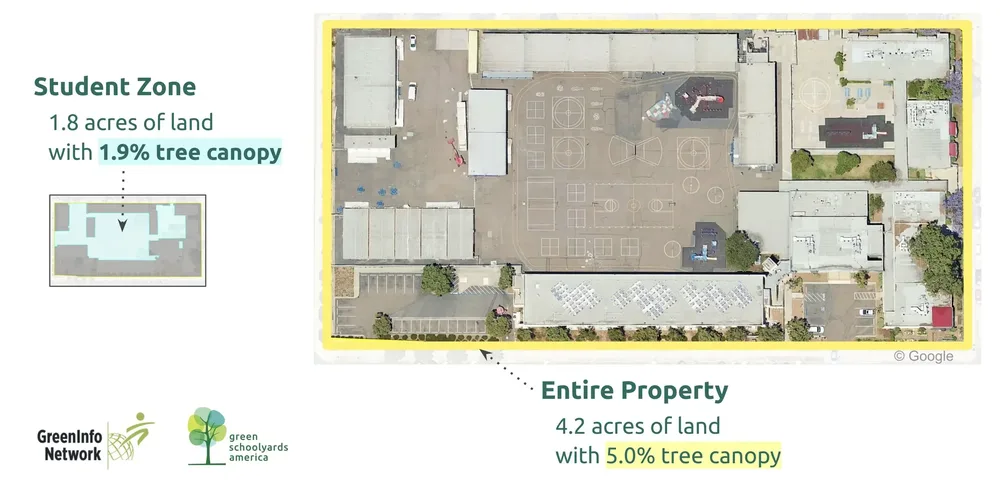
One way to measure tree cover is to divide the area covered by tree canopy by the total property area. That gives you a useful overall percentage, but it doesn’t tell you where the trees are. A school can have mature trees around its perimeter and very little tree cover over the playground.
The team mapped areas within each campus, excluding buildings and parking lots to identify what they called “student zones”: the outdoor areas children use during the school day. They could then compare tree cover across the whole property with tree cover in those student zones.
EarthDefine supplied the canopy data; the research team developed the analysis. The detail in the data mattered for work at this scale. At 60cm resolution, each pixel represents a square roughly two feet on each side. A 10m pixel covers about 1,076 square feet and can contain a mix of trees, grass, pavement, and buildings. Smaller pixels make it easier to map tree crowns in relation to playgrounds and other campus features. Canopy coverage is a measure of tree cover, though; it doesn’t show exactly where shade falls at every time of day.
Example of a schoolyard with no trees or shade
Example of a well-treed and shaded play area
The findings
The study, published in April 2024, found that:
- Median tree canopy coverage in California’s public school student zones was 6.4%.
- Only 45% of the tree canopy on public school properties was in areas accessible to students during the school day.
A whole-campus percentage would have missed that difference. Green Schoolyards America and its partners used the findings to create the California Schoolyard Tree Canopy Equity Map and a policy brief. The work also provides a baseline for the California Schoolyard Forest System, founded by Green Schoolyards America with the California Department of Education, CAL FIRE, and Ten Strands. Its goal is to plant enough trees by 2030 to cover at least 30% of each campus’s student zones when those trees mature.
How the study has been used
CalMatters covered the findings, and the California School Boards Association shared them with its members. Researchers have cited the study, and graduate theses have explored similar questions in other states. We’ve also heard from people who found EarthDefine through this work and wanted to discuss projects of their own.
The student-zone maps give school communities a way to see where tree cover is missing and where planting could benefit children. Green Schoolyards America and its partners deserve credit for asking that more specific question and doing the work to answer it.
What we learned
We often supply data without learning much about what happens after delivery. Following this project gave us a chance to see how the team used it, and to think about what we could have done differently.
For one thing, “60cm resolution” is easier to understand with an example. Here, it meant being able to map tree cover within a campus and compare the places children use with the rest of the property. That’s a more useful starting point for a conversation than the resolution number alone.
We also wish we’d asked more about the research when the inquiry first came in. We focused on getting the canopy data to them at an affordable price. Understanding the analysis would have given us a chance to discuss whether building footprints and parking-lot data could help them define the student zones. We can’t know whether that would have saved them time, but it was a conversation worth having.
If you’re planning a project, tell us what you’re trying to find out, even if you haven’t settled on the data you need. We can help you work through the options, including a smaller coverage area or a custom delivery. And if something else would serve you better, we’ll say so.
References:
- Green Schoolyards America: https://www.greenschoolyards.org/
- Tree Canopy Equity: https://www.greenschoolyards.org/tree-canopy-equity/
- Green Info Network: https://greeninfo.org/
- CalMatters news story
- California School Boards Association blog
- California Schoolyard Forest System
- California Department of Education
- CAL FIRE
- Ten Strands
- Texas A&M Forest Service grant program