
What is GIS?
Aug 3, 2026
GIS turns location into insight: layers of elevation, buildings, and land cover that answer questions a flat address list never could.
What exactly is GIS?
GIS stands for Geographic Information System. In simple terms, it's technology that connects information to a specific place on Earth, then lets you see it on a map, combine it with other information, and ask questions about it. A spreadsheet can tell you what's happening. GIS tells you where, and what else is happening around it.
Why it matters
Let's say you've got a list of addresses. On its own, that list is flat, and it doesn't tell you much about the things it represents. Like which of those buildings sit in a flood zone, which has a roof at risk from overhanging tree canopy, or which empty lot down the street would work well for a new store.
Line that same list up against a map with the right data underneath it, and those questions get much easier to answer. Location is what ties them together, and GIS is the tool that makes the connection visible.
How it works
Think of a GIS platform as a stack of layers over the same map: elevation, buildings, roads, vegetation, land cover, whatever's relevant. Each layer uses the same coordinate system and projection, so you can view one layer at a time or combine several.
On their own, individual layers don't tell you much. Combined, they do:
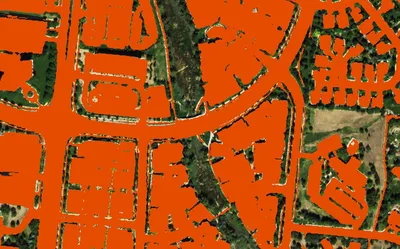
- A stormwater engineer might compare impervious surface data (pavement, rooftops, and other hard surfaces that don't let rain soak into the ground) against parcel lines (the boundaries of individual properties) to calculate a fair drainage fee.
- A wireless planner might combine building height and terrain to model line-of-sight (a clear, unobstructed path for a signal to travel between two points) for a new tower site.
That's true whether you're mapping a single parcel or an entire state. The difference at scale comes down to how the data was built in the first place, and what level of information is most useful to the people using it.
A layer only tells you what it shows, not how current or reliable it is. That comes down to the imagery and method behind it.
Building those layers by hand used to take years, walking a survey crew through an entire county. That has changed: aerial/satellite imagery and LiDAR data, processed with machine learning, can now produce Building Footprints, Canopy Height, and Land Cover at very high resolutions and frequent refresh rates, without waiting for the next manual survey.
The range is wide. Companies like ours offer products and solutions at 30-60cm resolution nationwide with a quarterly refresh rate. Specially tasked flights can capture imagery even at 1” resolution, while some satellite companies can provide fresh data everyday at a lower resolution. That's why GIS can now work at the scale of an entire city or state, not just a single project.
What it Makes Possible
Same tool, very different jobs depending on who's using it:
- Urban planning: Land Cover and building footprint data to guide zoning, density, and infrastructure decisions as a city grows.
- Telecom: Line-of-sight and clutter data (a map of buildings, trees, and other obstacles that can block a signal) for network planning, including 5G.
- Forest and wildlife conservation: Canopy Height and land cover data to map and reconnect wildlife corridors that development has broken up.
- Insurance: Building Footprints and vegetation proximity for flood and wildfire risk.
- Municipal and stormwater: Impervious surface extent for parcel-level drainage billing and stormwater system compliance.
- Real estate and retail: Footprints and parking capacity for site selection
- Utilities: Canopy height data to identify tall, dense vegetation that needs trimming as part of routine maintenance for telephone and electricity poles.
How is the underlying elevation and canopy data measured?
Everything starts with imagery (aerial, satellite, or ground-level camera) and a laser-based scanning method called LiDAR. LiDAR measures elevation and vegetation across an entire region at once, rather than site by site.
From that, two elevation surfaces get built. A Digital Elevation Model (DEM) is bare earth, with buildings and trees stripped out. A Digital Surface Model (DSM) keeps everything above ground in, including rooftops and treetops. Subtract one from the other, and what's left is the height of everything standing on the ground.
As a scanner passes overhead, it also records LiDAR returns: the individual laser pulses that bounce off branches and leaves before reaching the ground. Combine those returns with the DEM and DSM, and you get a Canopy Height Model (CHM), a reading of how tall the vegetation actually is across a region.
Building Footprints 3D works a little differently, since a building isn't ground or vegetation, it's a structure with edges to trace. AI models run on the same aerial imagery to pick out each building's outline, block by block. LiDAR then fills in the rest: height, roof slope, and attributes like roof max and roof min (the highest and lowest points of a roof), turning a flat outline into a three-dimensional model of the structure itself.
The Takeaway
None of this works if the underlying data is stale. A map is a snapshot, and an outdated snapshot is a guess dressed up as a fact.
That's the real argument for GIS built on current, high-resolution data. The mapping software isn't what does the heavy lifting; it's what's underneath it.
Curious what this looks like for your area? Request a free sample
Related products
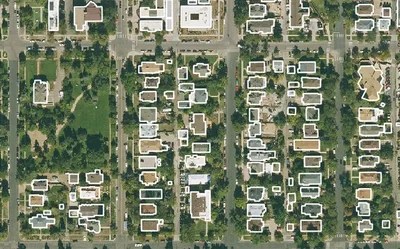
Building Footprints 3D
202M+ buildings mapped, with heights and elevations. Available off-the-shelf.
Learn more
Land Cover
Seven ground-cover classes at 30cm or 60cm resolution, produced on demand for your area of interest across the United States.
Learn more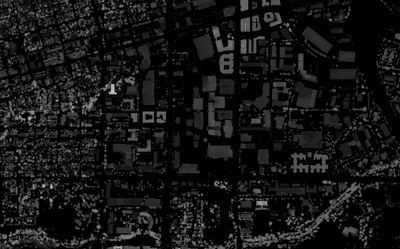
Impervious Map
Nationwide at 60cm. All impervious surfaces. Produced to order using the latest available imagery.
Learn more