Boulder Map Highlights Key Areas Needing New Trees and Best Shade Locations
Jul 18, 2023
Discover Boulder's new interactive map targeting key areas for tree planting and shading to boost the city's urban canopy.
9News
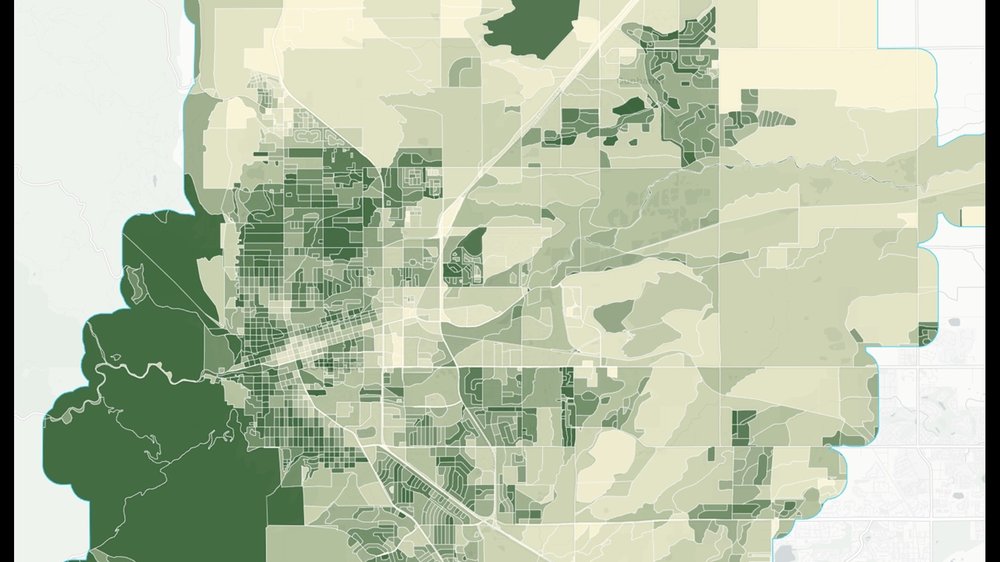
Boulder website shows specific areas that could use new trees, locations with best shade
Source:9News
BOULDER, Colorado. — There are few places to hide on a day as hot as Tuesday.
Yet if it weren’t for the more than 600,000 trees around Boulder, the high of 94 degrees on Tuesday would feel cool.
"One of the things that we’ve realized is that trees matter a lot, in terms of maintaining these safe, livable, urban settings," said Brett KenCairn, senior manager of Nature Based Climate Solutions for the City of Boulder.
KenCairn’s job at the city is to figure out how to keep Boulder cool. The key is in the shade.
Boulder just launched a website called TreePlotter Canopy that shows tree canopy around the city and how it’s changed over time. Anyone can see data, even searching for a specific address. Using the data, KenCairn can figure out which communities need more trees, which ones have the least shade, and what type of trees and greenery would do best in certain spots.
"Anything that is brown or beige, those are all places that we have lost canopy. As a planner, I now know where I’m starting to have deficits in the natural infrastructure that my community needs to protect itself from the kinds of changes that are coming," said KenCairn. "This is what is then going to help us figure out where do we want to go and start engaging those local communities and say, would you be interested in getting more shade, more cooling in your community? How can we work together to do that?"
The website compares 2015 to 2021 data to show the change in tree canopy over time. The city will use it to also figure out which trees or shrubs would work best in certain areas to help cool down temperatures and make the most of rain and water.
It uses data in part from a study last year conducted with the National Oceanic and Atmospheric Administration to research the impact shade has across cities. In Boulder, they marked temperatures around the city on one day to measure the impact of shade on a community.
"We are facing absolutely historic changes and there is no denying it and there is no avoiding it," said KenCairn. "So we have to now prepare our communities to live through and hopefully thrive in a very different context than most of us grew up in."
To read more, click on the link below:
Related products


Canopy Height Model
85%+ of the US at 60cm resolution. Tree heights in feet, updated annually.
Learn more