California’s Canopy Evolution: Mapping the Future of Urban Forests
Apr 29, 2025
Discover how California is using next-generation interactive mapping to visualize tree canopy changes and build heat-resilient communities.
CAL FIRE
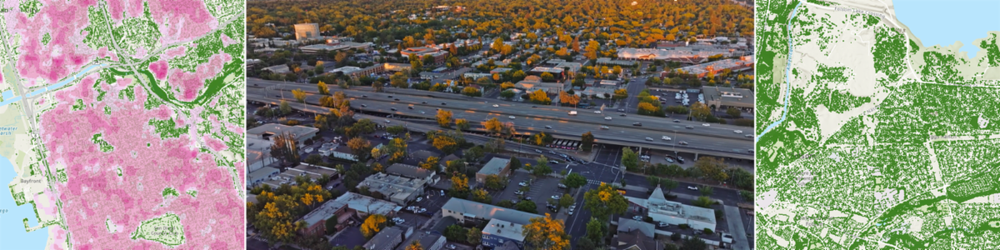
New Interactive California Urban Tree Canopy Tool Visualizes Tree Canopy Data And Change
Data will inform communities about where & how to maximize the valuable benefits of urban trees by CAL FIRE.
Sacramento — The California Department of Forestry and Fire Protection (CAL FIRE) is proud to announce a new interactive mapping tool to visualize urban tree canopy across California. This tool was developed in partnership with the USDA Forest Service and displays 2022 high-resolution (60cm) urban tree canopy for all 2020 Census designated urban areas in the state of California, as well as canopy-related change between 2018 and 2022.
Tree canopy is a critical component of California’s environmental infrastructure, offering wide-ranging benefits from reducing extreme heat and improving air quality to enhancing property values and wildlife habitat.
Related products


Canopy Height Model
85%+ of the US at 60cm resolution. Tree heights in feet, updated annually.
Learn more